
When Options Markets Whisper: A Professor's Experiment in Reading Institutional Fear
A real-time test of whether retail investors can decode the hidden language of professional traders

You stand in front of a whiteboard covered in financial data, explaining to your Northeastern University students how markets encode information. The irony isn’t lost on you: you teach algorithmic trading, computational finance, AI-powered investment systems. You run Humanitarians AI, a nonprofit building open-source frameworks to democratize financial intelligence. You wrote a thousand-page cancer biology textbook that required validating thousands of scientific assertions with evidence-based rigor.
And yet, when it comes to your own portfolio, you face the same problem as everyone else: where do you put money when everything is already expensive?
The tech stocks you bought a year ago have doubled. NVIDIA, AMD, the big names—they’ve run hard. Your systematic approach served you well: check fundamentals first, buy quality companies when they’re down, hold through volatility, rotate capital when opportunities emerge. It’s the strategy that crushes the competition in StockTrak trading simulations, generating 17% returns in six weeks while your students’ teams struggle to beat 2%.
But in early 2026, finding new opportunities feels harder. The entire sector seems priced for perfection.
Then Qualcomm starts bleeding. Down 12% through January on analyst downgrades and handset concerns. The stock that had touched $172 now trades at $151. Earnings are coming February 4th, and the whispers aren’t good.
You decide to test something you’ve been studying: whether options markets—the derivatives that institutions use to hedge billions in exposure—contain readable signals about what professional money actually thinks is going to happen.
This is the story of that experiment.
The Setup: When Smart Money Gets Nervous
Before the earnings announcement, with Qualcomm trading at $151, you pull up the options chain. This isn’t speculation—it’s reconnaissance. You want to know what institutional traders are paying for protection.
At the $155 strike price, the numbers tell a story:
Call option: $3.70 (betting on upside)
Put option: $6.50 (betting on downside)
The put costs 76% more than the call. Not a little more expensive—dramatically more.
You calculate the put/call ratio: 1.76x.
In the academic literature you’ve been reviewing, this qualifies as “elevated fear.” Normal markets trade closer to 1.0x (balanced). Moderate concern: 1.2-1.4x. What you’re seeing: institutions paying a significant premium for downside protection heading into a binary event.
But here’s where it gets interesting: when are they worried?
The Time Machine: Fear Curves Across Horizons
Options don’t just come in one flavor. You can buy protection expiring in one week, one month, three months, six months. Each expiration date reflects a different time horizon, a different bet about when risk materializes.
The pattern of prices across time—what professionals call the “term structure”—reveals whether anxiety is focused on a specific event or reflects deeper structural concern.
You check the 3-month options. Same strikes, same stock, but expiring in May instead of February.
The put/call ratio: 1.30x.
Still elevated, but noticeably lower than the 1.76x fear premium in the near-term options.
This is the pattern of temporary bearishness: high anxiety about an imminent catalyst (earnings), but relative calm about the business three months out.
If institutions thought Qualcomm had fundamental problems—losing competitive position, technology becoming obsolete, the business model breaking—you’d see elevated put premiums across all time horizons. Fear curves would be flat. Instead, the curve is steep: intense near-term worry dissipating over time.
The signal: “Q1 earnings will disappoint, but the company isn’t dying.”
You decide to wait. No entry before you have information.
The Validation: February 4th, 4:30 PM
Earnings hit after market close. Record revenue: $12.3 billion. Earnings beat expectations. The company executed brilliantly.
The stock drops 10% in minutes.
The culprit emerges in the guidance: a DRAM shortage. Memory manufacturers are redirecting capacity toward AI data centers, creating a supply bottleneck for smartphone memory. Qualcomm’s customers—phone makers—can’t get the components to finish devices, so they’re scaling back chip orders.
Not a demand problem. Not a competitive loss. An external supply chain constraint.
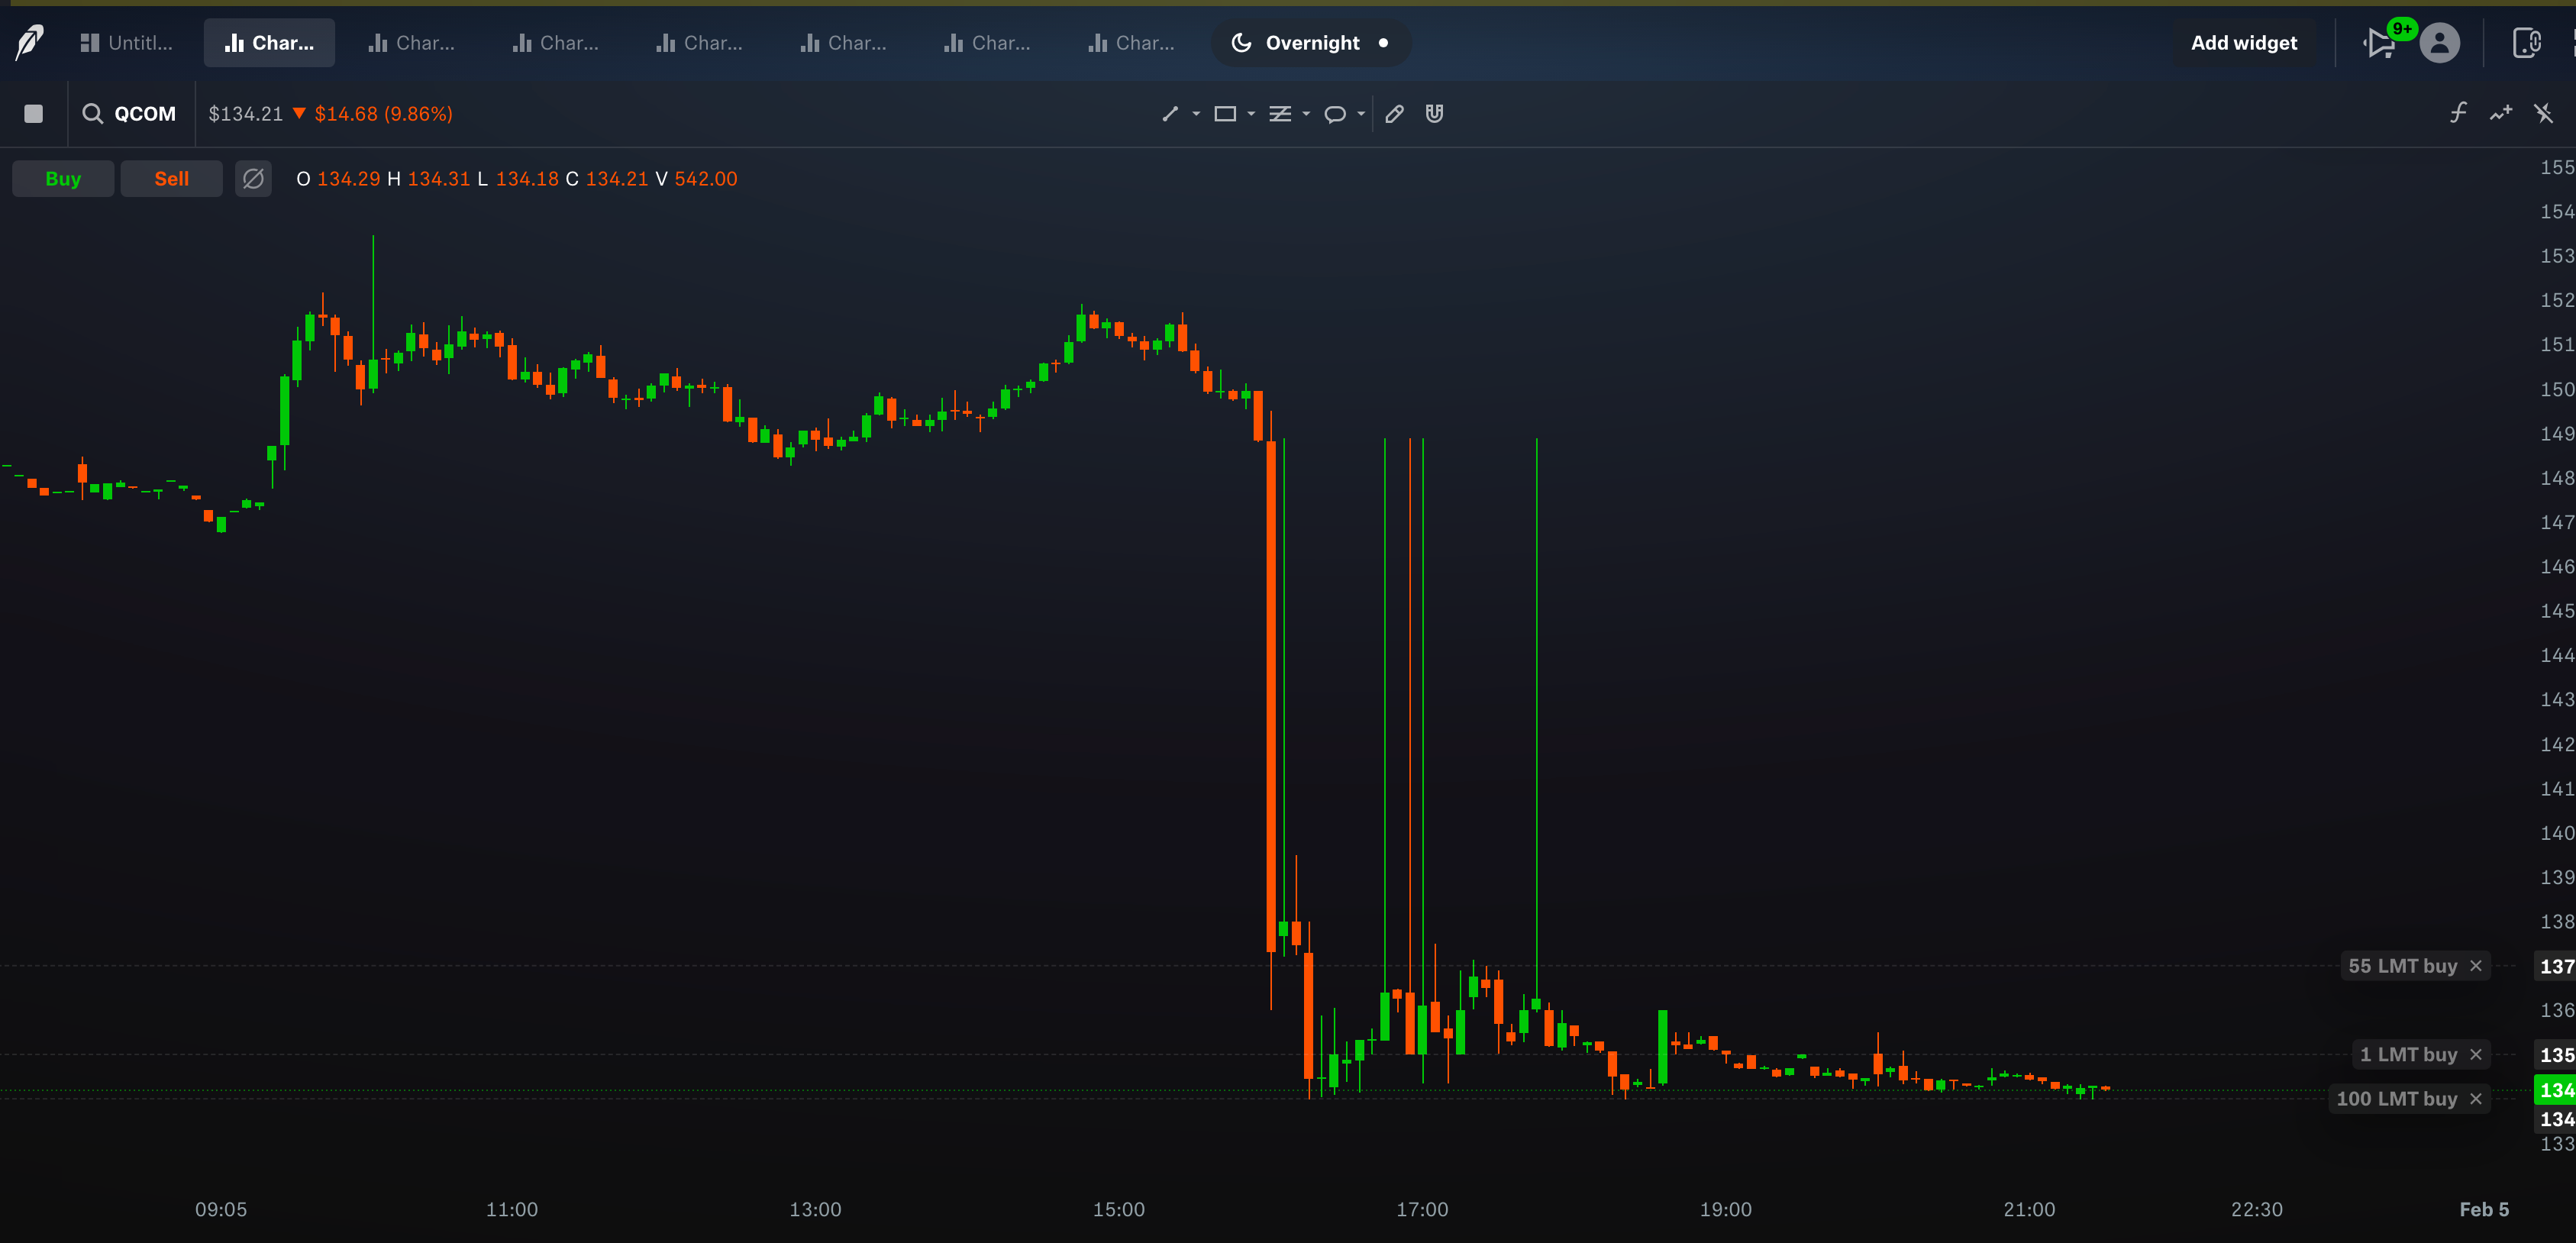
The stock gaps from $149 to $137 in the after-hours session, then whipsaws violently. By midnight, it’s settled around $134.
You check the options chain again. This is the test.
The Reversal: When Fear Becomes Opportunity
Post-earnings, with the stock at $134, you examine the May expiration (3.5 months out).
The numbers have completely flipped.
At the $145 strike:
May call: $16.00
May put: $11.65
Put/call ratio: 0.73x
Calls are now MORE expensive than puts. Not by a little—calls cost nearly 40% more.
At the $135 strike:
May call: $22.05
May put: $6.10
Put/call ratio: 0.28x
Calls are 3.6 times more expensive than puts.
Time Horizon              Put/Call Ratio    Market Narrative
──────────────────────────────────────────────────────────────
Pre-earnings (1-week)         1.76x         "Q1 will disappoint"
Post-earnings (2-day)         0.60x         "Stabilizing here"
Post-earnings (3-month)       0.22x         "Strong recovery expected"
Post-earnings (5.5-month)     0.24x         "Sustained rebound through summer"
The term structure has completely inverted. The market that was terrified of Q1 is now aggressively positioning for recovery by summer. Institutions aren’t just neutral—they’re paying enormous premiums for upside exposure.
This is what the research calls a “term structure reversal”—one of the most powerful patterns in volatility surface analysis.
The Entry: Limits, Variance, and Overnight Gaps
You set two limit orders before the market opens February 5th:
100 shares at $134
100 shares at $137
The limits aren’t predictions. They’re variance capture. You can’t watch the opening tick-by-tick—you teach classes, run a nonprofit, mentor graduate fellows working on everything from wastewater surveillance AI to protein design algorithms. The limits ensure you participate if the thesis plays out, without requiring you to stare at screens at 9:30 AM.
If it opens at $131, both orders fill at $131. If it opens at $136, you get partial fills. If it opens at $140, neither fills—and that’s fine. You missed it, but you protected capital.
The market opens at $132.50.
Both limits execute immediately. You own 200 shares at an average price of $132.50—$2.50 better than your most aggressive limit, $18.50 better than where you might have bought weeks earlier.
Three hours later, the stock trades at $139.
Unrealized gain: $1,300. A 4.9% move in 180 minutes.
But the number isn’t the point. The framework is.
What the Research Actually Shows
The academic literature on volatility surfaces isn’t new—it’s foundational to how institutions trade. What’s new is asking whether retail investors, using free broker apps and public data, can extract the same signals.
The research you’ve been reviewing validates several key mechanisms:
1. Informed Positioning Through Skew
When institutions expect mean reversion from non-fundamental shocks, they use out-of-the-money options for embedded leverage rather than buying stock directly. Academic studies document this produces alpha—one paper quantifies it at 50 basis points per week when the signal is strong.
The QCOM pattern fits precisely: temporary supply chain disruption (non-fundamental), options market pricing in recovery (informed positioning), rapid rebound when fear proves overdone (alpha capture).
2. The Mechanical Floor: Vanna and Charm
After major volatility events, something mechanical happens. When implied volatility collapses—the “IV crush”—market makers who sold puts during the panic are forced to buy back stock to maintain delta-neutral hedges. This isn’t opinion. It’s math.
The buying pressure is automatic, predictable, and often powerful enough to create technical floors regardless of fundamental news.
Your QCOM trade caught this: the bounce from $132.50 to $139 likely had significant mechanical component as dealers unwound their short gamma positions.
3. Retail Noise vs. Institutional Signal
One critical finding: the explosion in zero-day option trading by retail participants has distorted near-term volatility surfaces. Speculative demand in contracts expiring within days creates artificial “noise” that doesn’t reflect institutional consensus.
The solution: look further out. Three-month and six-month options are dominated by professional positioning—pension funds hedging, proprietary desks expressing views, structured products manufacturing. The term structure slope filters signal from noise.
The Uncomfortable Middle Ground
Markets are neither perfectly efficient nor completely rigged. They’re something messier: mostly efficient, occasionally exploitable, always probabilistic.
The QCOM options market correctly priced in that Q1 would disappoint. The 1.76x put/call ratio wasn’t wrong—earnings did miss expectations. But the term structure also correctly signaled that the fear was temporary, not structural. The recovery began within hours.
This challenges comfortable narratives:
Retail optimists: “Just buy the dip!” (Too simplistic—some dips keep dipping)
Efficient market purists: “You can’t beat professionals!” (Yet here’s public data showing their positioning)
Conspiracy theorists: “Markets are rigged!” (No—they’re just pricing in information you can learn to read)
The volatility surface occupies that uncomfortable middle ground where real research lives.
From One Trade to Systematic Validation
A single successful trade proves nothing. QCOM worked. Was it skill, or statistical noise dressed up as insight?
That’s why you’re turning this into a research project through Mycroft—your open-source framework for AI-powered investment intelligence. Not to hoard an edge, but to test whether one exists and make the methodology public regardless of the answer.
The research questions crystallize:
Cross-sectional test: In any given week, do stocks with elevated put/call skew underperform stocks with neutral skew? Or do they mean-revert?
Time-series test: When a stock’s skew reaches extreme levels relative to its own history, what happens over the next 2-4 weeks?
Term structure validation: Do “temporary bearishness” patterns (near-term fear, long-term calm) reliably predict post-catalyst recoveries across 100+ events?
Regime dependency: Do these signals work in bull markets but fail in bear markets? High VIX but not low VIX?
Optimal timing: How far before a catalyst should you enter? How long after should you hold?
This isn’t just academic curiosity. For your students—fellows working on everything from computational biology to AI ethics—this represents a publishable research opportunity. Test a framework rigorously. Build the data pipeline. Run the statistics. Report what you find, even if it contradicts the hypothesis.
Especially if it contradicts the hypothesis.
The Invitation: Science Over Salesmanship
You don’t need more personal trading wins. You need systematic validation. And your students need research projects that teach quantitative methods while producing career-relevant work.
The data requirements aren’t trivial:
Historical options data (all strikes, all expirations, 2020-2025)
Stock returns across multiple market regimes
Earnings calendars and corporate events
VIX regime classifications
Statistical significance testing accounting for multiple comparisons
But the tools exist. Polygon.io for historical data. Python for analysis. Open-source repositories for collaboration. And most critically: a framework—Popper, your AI validation methodology—that treats every assertion as hypothesis requiring evidence both for and against.
The same rigor that fact-checked a thousand-page cancer textbook can validate whether options markets contain exploitable signals.
Research deliverables:
Academic working paper (SSRN, potential Journal of Financial Data Science)
Open-source code repository (full replication materials)
LinkedIn series documenting findings
Educational framework for teaching market microstructure
Timeline: 3-4 months for a motivated researcher with Python skills and statistical training.
Career value: Demonstrable quantitative research capability, published work, contribution to financial democratization.
Intellectual honesty: Results published regardless of outcome. Negative findings are valuable findings.
Why This Matters: Leveling an Unlevel Field
Bloomberg Terminals cost $24,000 per year. Institutional investors have proprietary databases, PhD quants, and real-time skew monitoring systems. Retail investors have free broker apps and hope.
But the raw data—strike prices, implied volatilities, put/call ratios—is public. The interpretation is gatekept.
If volatility surface analysis works, making it accessible through open-source tools and transparent methodology doesn’t just help individual investors. It teaches an entire generation how to think probabilistically, how to distinguish temporary fear from permanent deterioration, how markets encode uncertainty.
And if it doesn’t work? That’s equally valuable. It prevents wasted effort chasing patterns that don’t exist. It documents where market efficiency holds. It demonstrates intellectual honesty over cheerleading.
Either way, the knowledge compounds.
One Data Point, Infinite Questions
Your QCOM trade continues. The stock that filled at $132.50 and bounced to $139 now faces the real test: do the May and July options—still showing massive call demand, still pricing in recovery to $150-160—prove correct?
You’re comfortable holding. The fundamentals are solid: record handset revenue, automotive growing 15%, licensing margins at 77%, strategic wins in software-defined vehicles and AI inference. The DRAM shortage is external and temporary. Management confirmed end-user demand remains strong.
The options market agrees. And this time, you understand why the agreement matters.
But one validation case isn’t systematic proof. It’s an invitation to investigate.
The Research Call
For students interested in quantitative finance, market microstructure, or AI applications in investing, this represents an open research problem:
Can retail-accessible volatility analysis provide predictive value, or are options markets fully efficient?
Test it. Build the pipeline. Run the statistics. Report the truth.
This is science applied to markets: propose hypotheses, define measurement criteria, gather evidence both supporting and contradicting, publish findings transparently—even when they challenge what you hoped to prove.
The Mycroft framework—”Using AI to Invest in AI”—extends to this: using systematic analysis to understand whether options markets contain readable signals, then making that understanding public regardless of commercial value.
If it works, it levels the playing field.
If it doesn’t, it prevents false confidence.
Both outcomes advance knowledge.
The framework is built. The hypothesis is stated. The validation awaits.
Interested in systematic backtesting of volatility surface analysis?
Ready to transform this from one professor’s successful trade into rigorous academic research?
Visit: humanitarians.ai/fellows
Or comment: What specific aspect would you test first?
This is Mycroft: open-source, transparent, evidence-based. Where institutional techniques meet democratic access, and where one good trade becomes a hundred systematic tests.
The options market whispered. We listened. Now let’s find out if what we heard was signal or noise.
Nik Bear Brown, PhD, MBA
Associate Teaching Professor, Northeastern University
Founder, Humanitarians AI
Mycroft Project Lead
The QCOM analysis represents a single validation case using publicly available options data. This narrative describes an actual trade and its outcome, but past performance does not guarantee future results. Options trading involves significant risk. All research findings, when published, will include full methodology and limitations.